9:40 AM
Service during rush
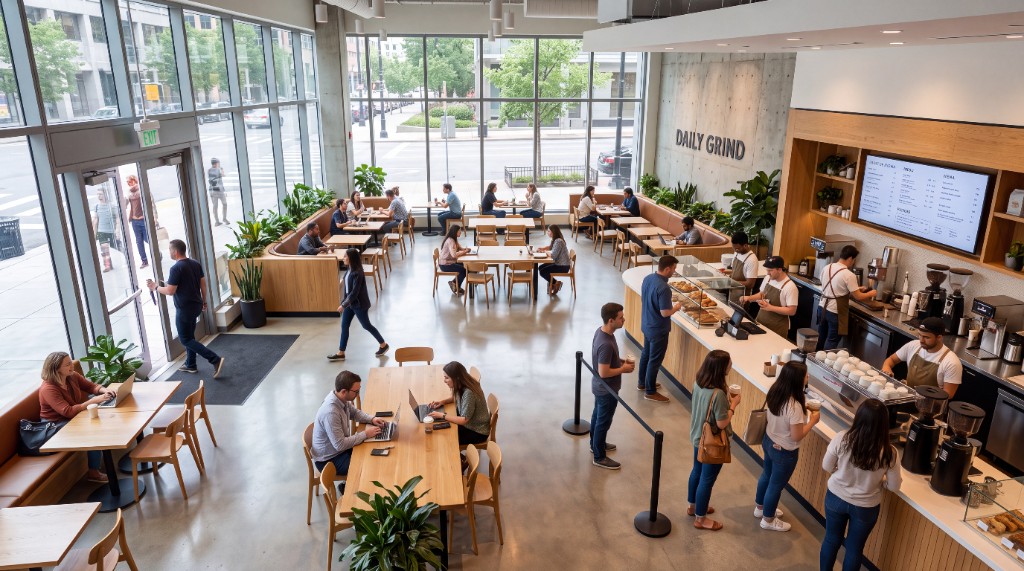
Rush hour at the counter. The line stayed short while occupancy peaked.
Sample report
Harbor Coffee — a fictional demo location.
Current report — fictional café data, not a live capture.
Visitor analysis report
Front counter camera
Executive summary
Rush peaked at 22 people at 9:40 AM. The order line stayed short. Seating filled, and people stood nearby waiting for a table.
Key metrics
Average occupancy
10.7
Average number of people visible.
Peak occupancy
22
Highest number of people visible at the same time.
Active analysis duration
3 hours
Frames analyzed
540
Tracked visitor sessions
47
Anonymous continuous appearances — not unique visitors.
Camera-wide occupancy and activity density may include people detected in employee-only areas.
What worked well
Supported by evidence in this analysis
Finding
Customers were not kept waiting during the morning rush.
Evidence
The order line stayed short at peak occupancy.
View supporting momentService during the 9:40 AM rush.
Occupancy over time
People visible during the analysis
Peak · 22
9:40 AM
22
Sat, Sep 12
Peak
Occupancy rose and fell, with a clear rush of 22 people at 9:40 AM.
Venue Overview
Today's Space Analytics
Representative frame · 9:40 AM
Demo photo — fictional venue, not customer footage
Camera-wide occupancy and activity density may include people detected in employee-only areas.
Daily Report Summary
Zone Performance
Activity across your configured zones. Confirmed visits require about 2.5 seconds of sustained presence — not a one-frame walk-through, and not unique visitors. Stayed 12s+ is the share of those visits that lasted at least 12 seconds. Brief pass-throughs are not this visits column. Operational status reflects venue and zone role, not ranking alone.
Entrance
entrance
Order line
queue ordering
Pickup A
counter pickup
Pickup B
counter pickup
Seating
seating
Pastry case
display
| Zone | Peak visibleⓘ | Confirmed visitsⓘ | Dwellⓘ | Stayed 12s+ⓘ | Shareⓘ | Operational statusⓘ |
|---|---|---|---|---|---|---|
Entrance entrance | 4 | 42 | 18s | 12% | 18% | Performing well |
Order line queue ordering | 4 | 36 | 32s | 28% | 16% | Performing well |
Pickup A counter pickup | 5 | 28 | 48s | 46% | 20% | Monitor |
Pickup B counter pickup | 2 | 7 | 22s | 29% | 5% | Observation only |
Seating seating | 12 | 38 | 12m | 86% | 48% | Monitor |
Pastry case display | 3 | 19 | 36s | 42% | 12% | Monitor |
People also stood near seating while tables stayed occupied.
Recommended next steps
Supported by evidence in this analysis
Finding
Add seating. Tables stayed full while people stood waiting nearby.
Evidence
People stood next to occupied tables instead of finding a seat.
Confidence / limitation
Occupancy and standing activity — not wait time in seconds.
View supporting momentSeating full, with people standing nearby.
Supporting Moments
The camera view behind each finding. Demo photo — not customer footage.
9:40 AM
Service during rush
Rush hour at the counter. The line stayed short while occupancy peaked.
9:40 AM
Seating
Seating stayed full. People stood nearby waiting for a table.
Data quality
Occupancy is scored from detections in sampled frames. The tracking percentage is how continuously anonymous visitors could be followed between those samples — not a recount of people, and not a claim that sessions failed.
Frame completeness
98%
Effective sampling
20s
Detection / frame quality
Reliable86%
Anonymous session tracking
Directional72%
Visitor sessions
Available
Session tracking is directional for this window. Occupancy, zone presence, and the findings above still meet the evidence bar used in the sample.
Want a report like this for your venue?
Request a free pilot